Search results for: Agile+Product+Ownership+in+a+Nutshell

Continue reading: Agile Product Ownership in a nutshell

Agile Product Ownership in a nutshell

This is basically a 1 day product ownership course compressed into a 15 minute animated presentation.

Over a million views! Some call it “The best 15 minutes on the Internet” 🙂

There’s obviously more to product ownership than this, so see this is a high level summary.

Special thanks to Alistair Cockburn, Tom & Mary Poppendieck, Jeff Patton, Ron Jeffries, Jeff Sutherland, and Michael Dubakov for providing many of the models, metaphors, and ideas that I use in this presentation.

Translations: (see also the translation guide by Cédric Chevalerias)

Below is a full transcript in english. But I recommend watching the video instead of reading the transcript. The video is 100% visual, the transcript is 0% visual…

Continue reading

Continue reading: Focus – my keynote at AgileByExample, Warsaw

Focus – my keynote at AgileByExample, Warsaw

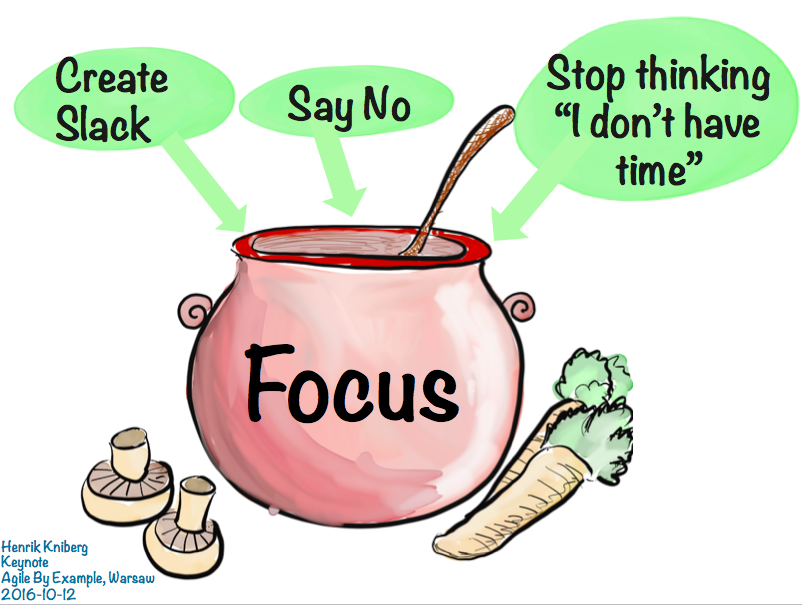
Here is my slide (yes, it’s just one slide) from my keynote at AgileByExample in Warsaw. And a video of the talk. Scroll down for a written summary.

Focus

Continue reading

Continue reading: Scaling Agile (but not in the way you think…)

Scaling Agile (but not in the way you think…)

For more than a year now, I’ve been working with clients that have agile scaling problems. But not the kind of scaling problem everybody is talking about – one product and lots of teams. No, I’ve been busy trying to sort out what to do when you have one team supporting a multitude of products with different architectures, stakeholders, technology stacks and whatnot. This is what I’ve learnt, so far.

Continue reading

Continue reading: Team barometer (self-evaluation tool)

Team barometer (self-evaluation tool)

Sometimes it’s hard for a team to know if they get tighter and better as a team over time. This is a tool that allows a team to learn just that.

Team barometer (self-evaluation tool) in a nutshell

The barometer is executed as a survey in a workshop. The survey consists of 16 team characteristics, packaged as a deck of cards. Team members vote green, yellow or red for each card in the meeting (or before the meeting as an anonymous survey). Once all cards have been run through, the team reflects and discusses the results. You can, if you want to, run through the exercise in thirty minutes, but I recommend to set aside an hour.

Click here to download the cards.
Continue reading

Continue reading: How I write (and why)

How I write (and why)

The purpose of this article is…
Actually, there is no purpose. There never is. I just write because I feel like it. Then I read the article and make up a purpose afterwards, and start eliminating anything in the article that doesn’t fit that purpose. But I won’t do that this time. Read on and you’ll understand why. By the way, this text is blue because it’s my second iteration. Black text is the original, first iteration. Here it is:

Let me tell you about my creative process. Every writer has a creative process. Otherwise they wouldn’t get anything written; well, at least not anything creative 🙂Continue reading

Continue reading: The Solution to Technical Debt

The Solution to Technical Debt

(related article: Good and Bad Technical Debt – and how TDD helps)
(Translations: Russian)

Are you in a software development team, trying to be agile? Next time the team gets together, ask:

How do we feel about the quality of our code?

Everyone rates it on a scale of 1-5, where 5 means “It’s great, I’m proud of it!” and 1 means “Total crap”. Compare. If you see mostly 4s and 5s, and nothing under 3, then never mind the rest of this article.

If you see great variation, like some 5s and some 1s, then you need to explore this. Are the different ratings for different parts of the code? If so, why is the quality so different? Are the different ratings for the same code? If so, what do the different individuals actually mean by quality?

Most likely, however, you will see a bunch of 2s or worse, and very few 4s and 5s. The term for this is Technical Debt, although for the purpose of this article I’ll simply call it Crappy Code.

Congratulations, you have just revealed a serious problem! You have even quantified it. And it took you only a minute. Anyone can do this, you don’t have to be Agile Coach or Scrum Master. Go ahead, make it crystal clear – graph the results on a whiteboard, put it up on the wall. Visualizing a problem is a big step towards solving it!

Don’t worry, you aren’t alone, this is a very common problem. <rant>However, it’s also a very stupid, unnecessary problem so I’m baffled by why it is so common.</rant>

Now you need to ask yourselves some tough questions.

Continue reading