Hi!
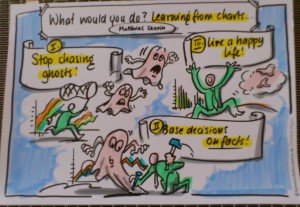
Just back from a great conference – LKCE 2012 – and a great town – Vienna. A really cool thing was the illustrator who worked around the clock to visualize how he interpreted the difference presentations. He did a great job (see below).

What would you do – learning from charts
I challenge the audience to figure out “what should happen next” and then tell the story what really happened.
Improving flow from marketing to production
A case story of how we used kanban to tie together a full value stream across four functions. It might be interesting to notice that we used component teams + we don’t use product owners or project managers. While we are still learning, I do think we have some interesting findings so far.


Both link seems to point to the same presentation.
Thanks
Phil
Darn! Should now be fixed! Thanks!
/Mattias