So you have a LARGE backlog and you have decided that you need to estimate it.
Not on board? Still undecided? Go read my previous post on the tradeoffs between estimating and not estimating large backlogs.
Still reading? Ok, let’s get to it!
You can do larger scale estimation in MANY ways. What I will share with you here is just one way I have found to do it effectively, with enough accuracy at a reasonable cost. It requires some pre-conditions, such as having a team with an established way of working and some way of estimating on the team level, so it may not fit your situation. But if it does it is probably worth your time to check out.
I have used it in two real life scenarios for large efforts. In both cases the estimates using this method ended up being much more accurate compared to upfront time estimates done before the work was started and by individuals who had expert level knowledge but were not involved with doing the work.
In the first case three different independent parties estimated a large effort to around 18 team months of work. The result of the first bucket estimation a few months after work was started came in at an estimate of about 9.5 team years of work – more than six times more than expected. Actual outcome ended up being 10 team years for about the same scope as initially estimated. The second case was a similar story.
Now, I don’t think anybody should expect results of this method to always be this close! But after experiencing this I am convinced that how you create your estimates can matter a lot.
Bucket Estimation Principles
- One day timebox, or less – spend little now to estimate a LOT of work
- Relative estimation
- Done by the people involved with doing the work
- Use wisdom of the crowd to very quickly place each item into one of just a few buckets of radically different sizes
- Estimate the weight of the buckets by estimating just a few sample items from each bucket
- Use same approach as your day-to-day agile team level estimation to estimate sample items
- Relate total estimates to actual track record (yesterday’s weather)
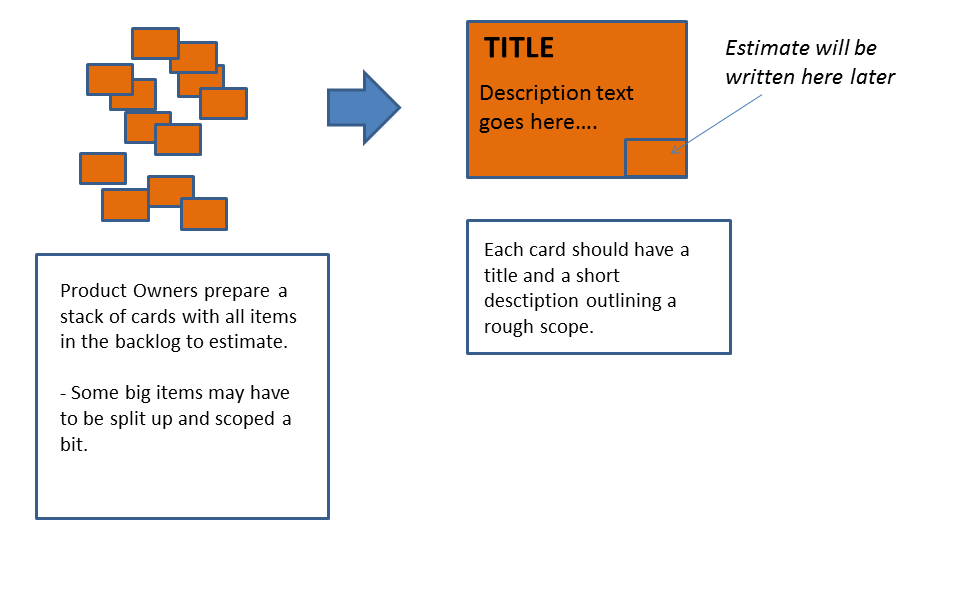 Preparations are performed by the people who have assembled the large backlog and have insight into what needs to be built. NOTE – this is a large backlog. Items are ok to be LARGE but need to describe something either with customer/user value or something of necessity to enable that.
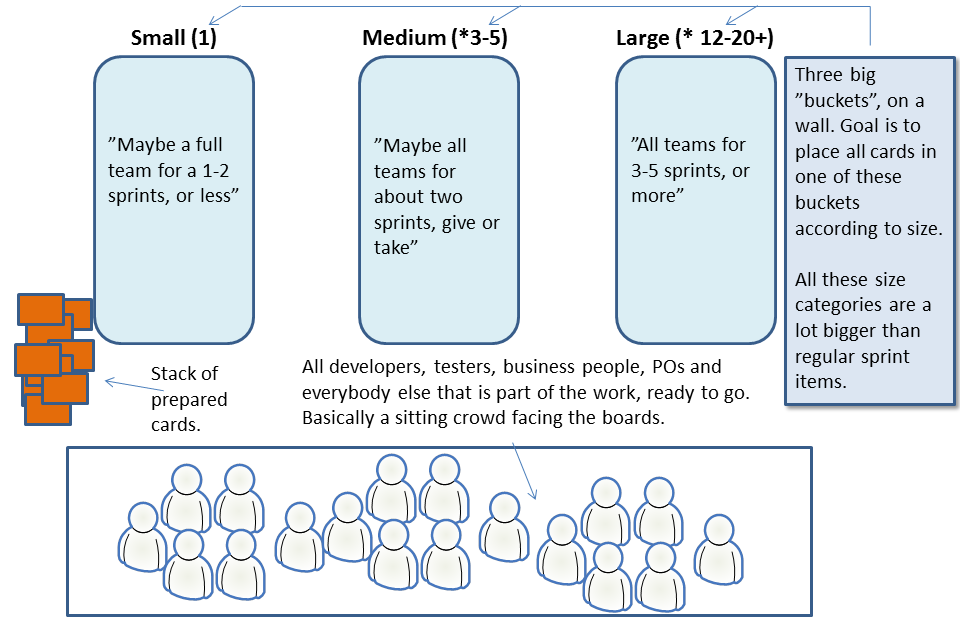
The setup phase is to arrange three buckets of very different sizes at a suitable location and invite all people who have valuable insight. You then do the estimation work in three basic phases and by using wisdom of the crowd.
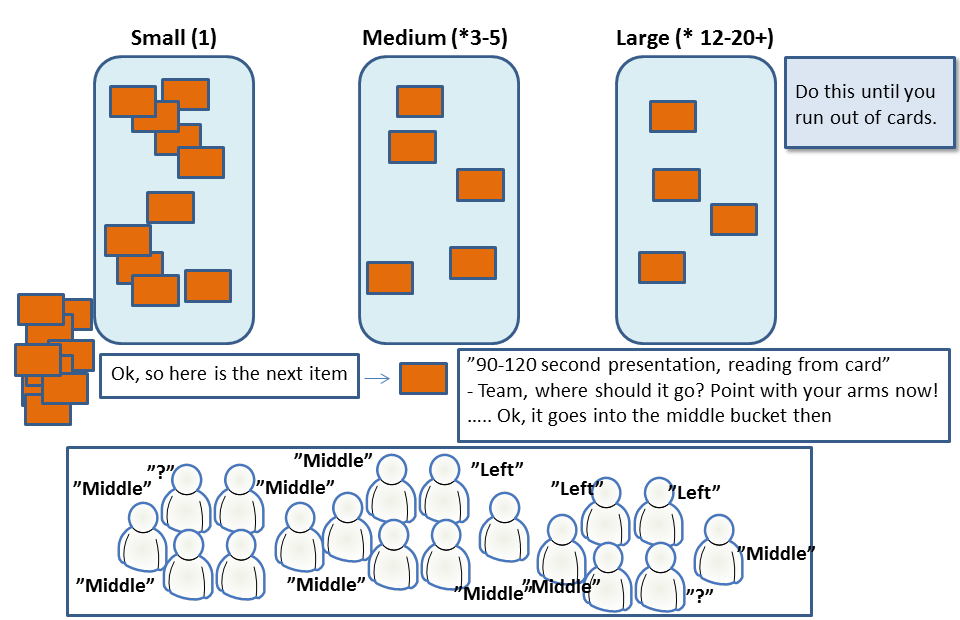 First phase, place each backlog item in a bucket of radically different sizes – all clearly larger than user stories that could fit in an agile team iteration. Spend 90-120 seconds to present an item, then ask the crowd to all point for a decision. Make the call, place it in a bucket and move on. Yes, some of the items may end up in the wrong bucket here and there. That’s ok, don’t worry about it at this point.
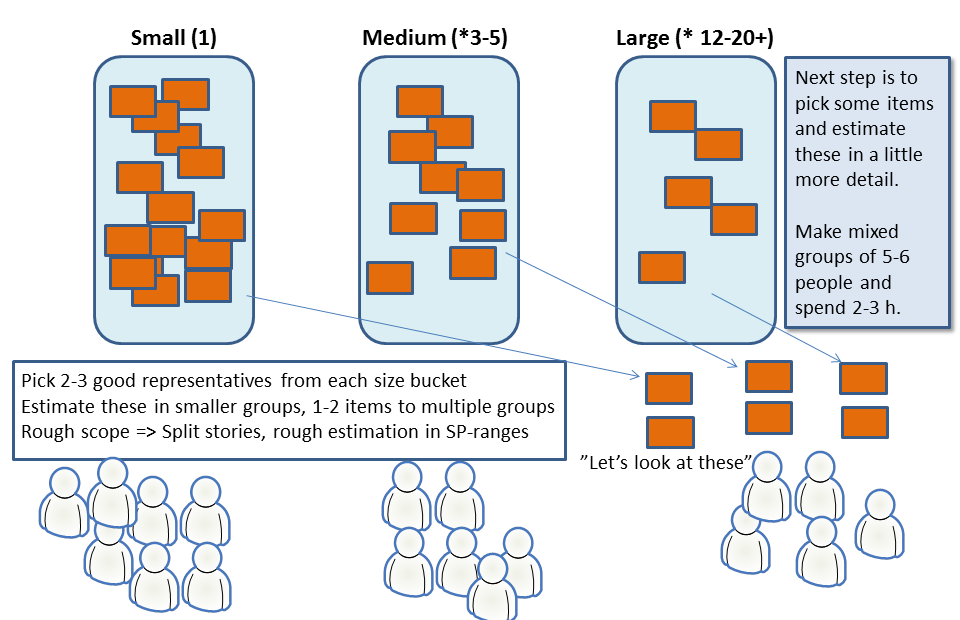 Second phase. For each bucket, select a very low number of sample items that are judged to be good representatives of that bucket. With three main buckets maybe 6-8 sample items in total is all you will need. If you are many teams you can select more. Break up into smaller diverse groups. Each group grabs 2-3 items to be broken down and estimated in story points or whatever estimation unit you are already using. This is similar to a very rough backlog grooming session. Some of the sample items can be given to more than one group, to cross-check a bit.
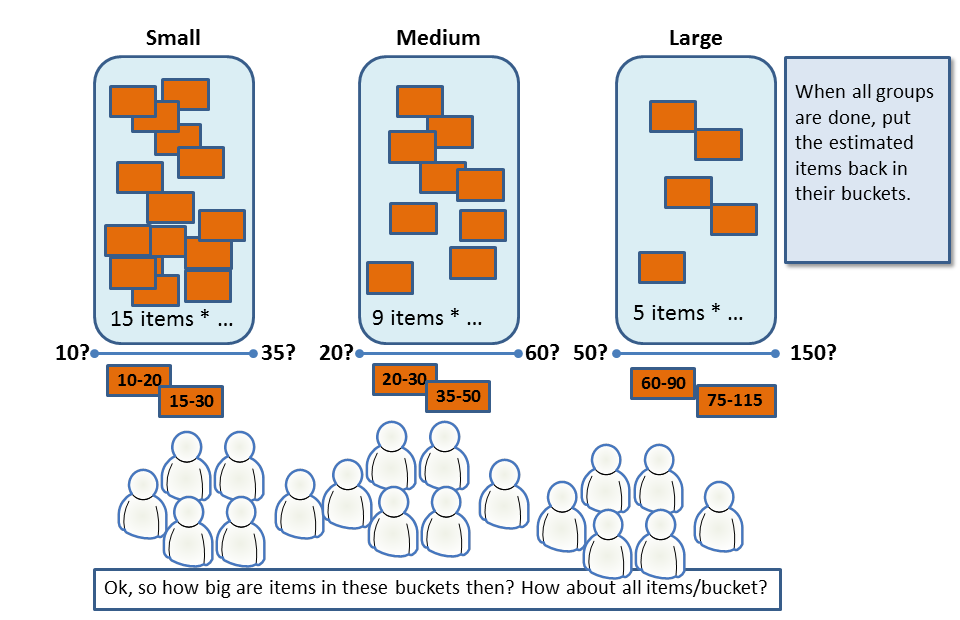 Third phase. All sample items are placed back in their respective buckets, now with estimates (range) written on them. The sample items are used to estimate the size of an average item in the bucket. Decide on a low to high range for the center of gravity of each bucket.
 Fourth phase. As an optional step you may decide to dot-vote on what items are “risky” or “unclear”, according to the wisdom of the crowd. This becomes input for what items in the backlog will need more work.
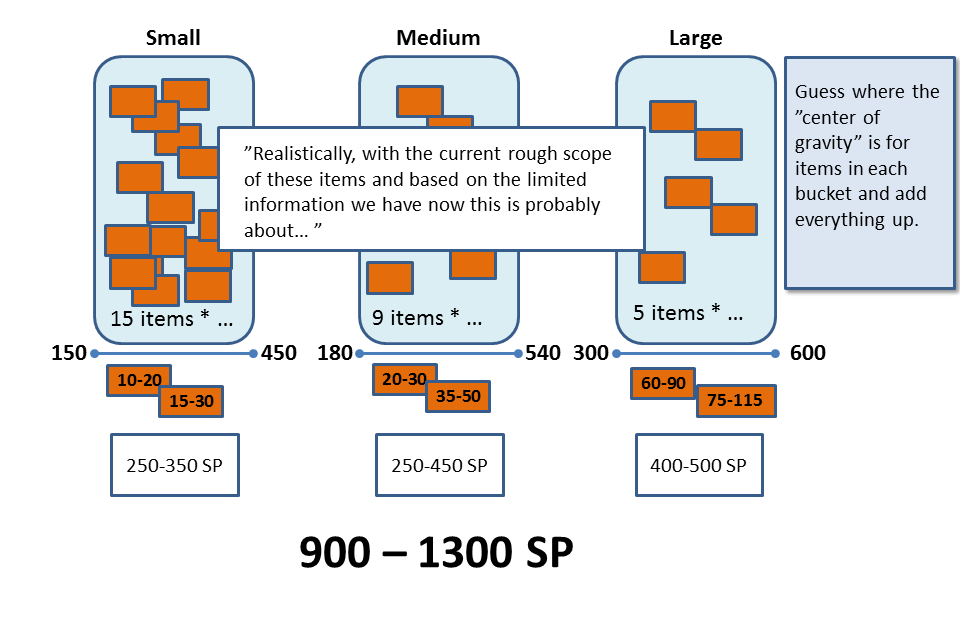 Wrap up by multiplying the lower and higher numbers with the number of items in the bucket. Add up all buckets. Size done!
You now have a low to high value for the whole backlog!
Now make a forecast for future velocity. You can just make a guess based on recent velocity. Or you can let everybody pick a low to high number and average these out to a “wisdom of the crowd” low/high forecast velocity.
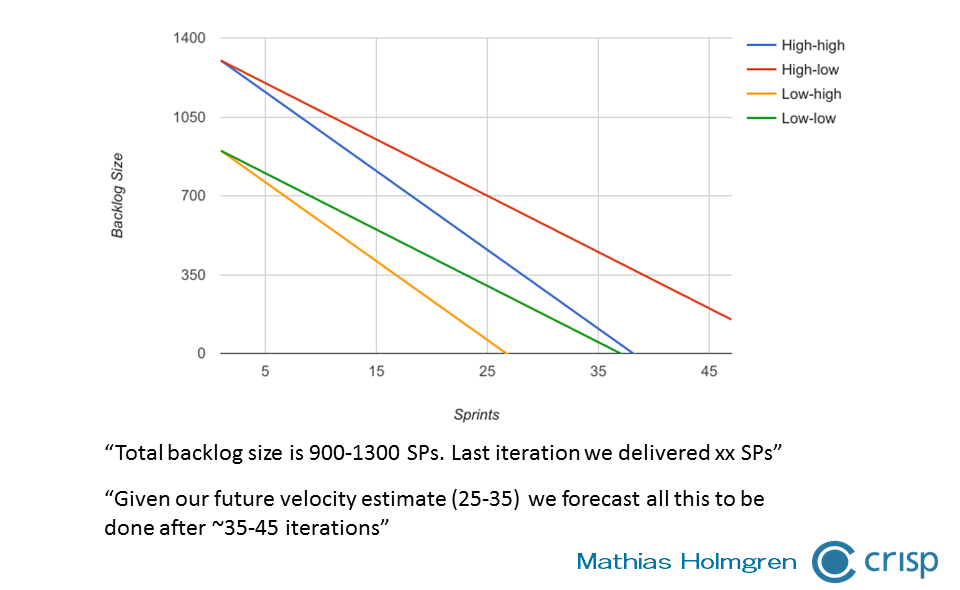 Visualize it by making for example a large backlog burndown forecast. Assuming an unchanged capacity, this will give you a calendar prediction. On top of that data, everybody who participated now have a “gut feeling” of not just the size and scope of the large backlog. But also of just how much uncertainty is in this estimate.
It is important to understand that we are not going for accuracy here. We are creating a rough estimate. Some items may end up in the wrong bucket and some estimates may be wrong. Some errors will even themselves out. All we really are going for is establishing a range of likely outcomes so that we can quantify a DEGREE of uncertainty. And if we do this regularly we will learn as we go and our estimations will gradually improve.
My experience is that using wisdom of the crowd like this creates a shared experience that impacts behavior afterwards and this has strong tacit value. We all participated in creating the data that our forecast was built from, so it is probably not completely wrong!
Storytelling version, with more details
For those who learn better by reading about something in a story telling format, here is a write up I did to make it a more fun read. For those interested, this version also has some pictures from real workshops and that display some actual results from this estimation method. Enjoy!
Share and help us learn!
If you use bucket estimation for YOUR backlog, let us all know. Share in the comments about how it worked out for you so we can all learn from it!


Hi Mathias,
very intriguing – I really like to give it a try.
Is there a video available about this method? When seraching youtube for it, I always end up with “complexity bitbucket estimation” which seems a little bit more complex 😉
Cheers,
Chris
I’ve not made a video on it and have not seen anybody else cover it.
I am not familiar with complexity bitbucket estimation, but a super quick look at the first video hit gives me the impression that it features estimation by discipline and then adding those up, which I don’t recommend anybody to do (too much work for a large backlog, false precision, sub-communicates too much division of responsibilities, too many assumptions about details for work far in the future we know not enough about, complex not complicated..).
It does look like it uses rough size estimation, but it looks questionable if it is doing relative estimation well – that is, relating upcoming work to already completed work, and estimating size by that comparision – not by comparing one upcoming piece of work to another piece of upcoming work. If it is only the latter I would not recommend it.
The first time I used this bucket estimation as described in this article was in 2010 (one of the field examples from the article) there was nothing on this subject at the time. This is the method I invented then, and have used several times since. I am sure there are some great estimation techniques for big backlogs out there that I don’t know about, but I have yet to run into a better one in the field.
Hope that helps
Amazing read. Very interesting.
I have a few questions on the third phase:
* “All sample items are placed back in their respective buckets, now with estimates (range) written on them.”
How do you find these ranges? I was expecting the sample cards to be sized with a concrete value.
* “Decide on a low to high range for the center of gravity of each bucket.”
Any suggestion on how to decide this center of gravity?
Hello Ricardo,
“How do you find these ranges”
This is explained in the “second phase” paragraph. Given a backlog item, use the team’s normal backlog refinement approach to very roughly split the item into multiple story sized items and rougly estimate size of each one, which may be a number or a range (9, 10-12, etc). Add all of these up and you get a range of size for the backlog item (5, 7, 9-13, 12-14, 8-10 = 41-48 so let’s say 40-50 in size).
“Any suggestion on how to decide this center of gravity?”
It is pretty easy in practice. The idea here is to ballpark the width of the bucket. So let’s say we have a bucket with the following sample backlog item sizes: 18, 20-25, 30-35, 25, 18-23, 26-30, 28-36. We can say that the center of gravity of the bucket is probably something like 20-30, with some items at the edges of that range but most inside it.
This is not so much a big “decision” as it is an assessment informed by the data collected. If you find that hard, then ask a couple of people to make their assessment and use their average.
Thank you for the reply!
I was wondering how this methodology managed to deal with uncertainty in items (lack of know-how, new tech, external dependencies, …). Especially with rough estimations.
It seems that with ranges and by ball-parking the width of the bucket, we account for it and get a close approximation of the real value.
What’s the smallest group you’ve applied this methodology with?
Seems like this exercise benefits from having larger groups to remove outliers (to reduce deviation on the averages done throughout the phases)
I think the smallest was about 10 people, if I remember correctly.