


Rigid detailed long-term plans, where progress is tracked based on consumed budgets, are in agile organizations quickly becoming a fading nostalgic memory of the past. They are replaced by forecasts and non-static roadmaps. Gather regularly in front of these visualizations and you will enable learning, sharing and trigger important conversations, resolve dependencies and invite to acts of servant leadership. Make your OKRs and Forecasts come alive!
In this blog I want to give examples of visualizations with accompanying recurring ceremonies. The visualization and accompanying ceremony enable sharing of progress and ensure that impediments and dependencies continuously are addressed and mitigated. It also turns the forecast into a conversation (as opposed to a fixed estimate captured in a project plan that is treated as a promise).
The core question the involved teams answer is:
“How confident do you feel that you will accomplish the Key Result before the end of this quarter?”

If you are unfamiliar with the concept of OKRs, Objectives and Key Results, you can think of an Objective as “Let’s double down on this area/problem/need” and Key Results as “Let’s accomplish this specific impact/result/goal/deliverable which will drive us towards our Objective”. For every given quarter the number of Objectives is usually limited to 3-5. Each Objective in turn has 3-5 Key Results. A common guideline is also that on average you are expected to succeed with 70% of your Key Results, i.e. fail with 30%, and that is normal and accepted. This guideline ensures that we set bold goals and avoid playing it safe. Why? Well, if we punish anything less than a 100% success rate, we will eventually optimize for mediocracy.
.
The OKR Board Stand-up meeting
I was working as an agile coach at Spotify when OKRs were reintroduced 2017. The tribe (think semi-autonomous department) I was working in didn’t want the OKRs to be a static slide in a PowerPoint that is soon forgotten – but a living “plan” we could gather around to figure out how to help each other.
Instead of summarizing the collectively collaborated OKRs of the Tribe in a digital presentation we instead wrote them down on a big whiteboard positioned highly visible in the hallway next to all the teams. Once every second week we had our OKR Board Stand-up. Everyone who wanted to join was welcome, but we requested that at least two representatives from each of the eight teams attended.
The routine of the meeting was simple. We walked the board, one objective at a time. For each objective we read the wording of the Key Result out loud. The teams doing the work, providing to that Key Result, briefly shared progress and announced their confidence level. The meeting lasted 15 to 25 minutes.
.
Confidence Level
For each Key Result, the teams involved answered the question:
“Do you feel confident that you will accomplish the Key Result before the end of this quarter?”

Green Confident Smiley – Totally confident. This will happen. We can prepare the marketing campaign.
Orange Concerned Smiley – We might not make it. We should probably alert stakeholders.

Red Sad Smiley – No way. This won’t happen within this quarter. We’re still working on it though.

Check – DONE. Shipped. Accomplished.

Cross – We’ve stopped working on this (…because of change of priorities or that the Key Result itself has become irrelevant).
Below each Key Result there were 6-7 boxes (depending on how many two-week cycles occurred in the quarter), one box for each OKR Board Standup. When we had the third standup, we filled in the third box, and so on. This approach gave us with an historical perspective to our confidence level.
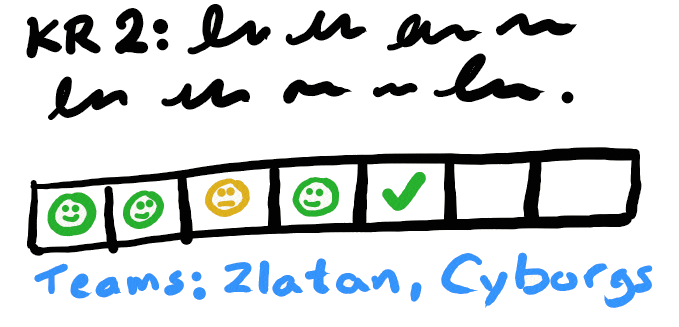
If several teams were providing to the same Key Result they each shared their progress and confidence level. However, the most pessimistic confidence level was the one being noted in the box.
The name of the team (or teams) providing to a Key Result, was written in small text below the boxes.
We actually had a sixth symbol – ?. A question mark meant that “We don’t know yet”. Sometimes that turned out to be the reality, they really didn’t know. But for me that was weird. How can a team allow themselves to “commit” to a Key Result if they aren’t confident that they have a shot at achieving it within the OKR cycle? But it turned out to be useful, so we used it.
.
Crucial Conversation Triggers
The important thing was however not the confidence smiley update itself – the important event was when the colour of the smiley changed colour from last OKR Board Stand-up.
Those changes were crucial triggers for important conversations. When a green smiley turned into an orange or red smiley, we paused the round to discuss and didn’t proceed until we collectively figured out how to act. Who in the room could help out? Who in the room could connect the team in need with someone that can help? Do we need to alert stakeholders? Who alerts stakeholders? What needs to change for the confidence level to go up? Etc.
Only once at least one strong action had been decided upon (that had the potential to propel us forward), we moved on to the next Key Result.
Even though each team tried their best to mitigate impediments and resolve dependencies daily on their own, the OKR Board Stand-up provided a recurring opportunity to escalate the problem or need to a wider supportive organization of friends and leaders.
.
Celebrating DONE
When someone announce they were “done” with a Key Result, drawing a check in the box, we obviously celebrated with a thunderous applause.
.
Opportunity for Servant Leadership
Initially the OKR Board Stand-up was facilitated by one the agile coaches. For the first few stand-ups, none of the three Tribe Leads succeeded to find time to participate. But on the fourth stand-up one of them joined in.
Within a few minutes I believe he realised that this was a golden and precious opportunity to read the pulse of all the teams, to get an aggregated view of the progress and to provide helpful acts of servant leadership. He could provide advice (when asked), suggest paths forward when teams were faced with tough choices, and offer help to connect teams in need with stakeholders and other parts of the organization thanks to his or her wider network.
The next OKR Board Stand-up, all three Tribe Leads joined as observers, ready to provide help and support when asked. And soon they even took turns to facilitate the ceremony itself.
.
OKR Board Review meeting
Once the quarter had ended, we gathered for an OKR Board Review meeting. We reviewed the Key Results we had accomplished and discussed the ones we hadn’t. What could we learn? What could we take with us to the next OKR Cycle. How could we improve the visualization and OKR Board Stand-up?
.
% Done Work
The second quarter we run our OKR Board Stand-up we added an aspect to try to make the progress update more complete. For each Key Result, the teams involved didn’t only answer how confident they felt, but they also guesstimated how much work they had completed so far.
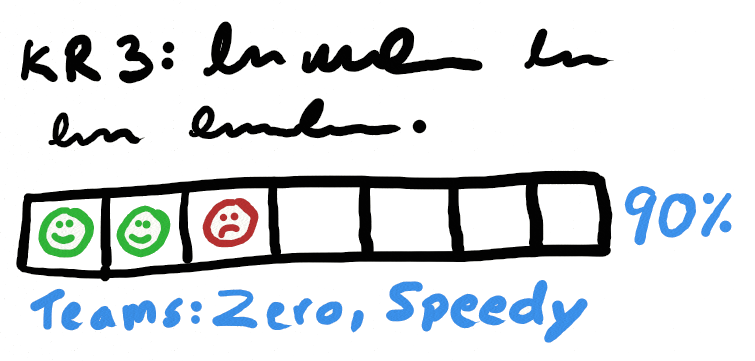
Why did we do this? Well, we felt we lacked a part of the story. We learned that sometimes there were teams that felt super confident even though they only guessed they had completed 10% of the work. And sometimes the teams felt very pessimistic even though 90% of the work was done. In some situations, this turned out to be very useful information. The estimate was a cut feeling guess rounded to the nearest tenth.
.
It went viral
When it was time for the next OKR cycle, the way we did our OKR Board follow-ups had spread internally. To our pleasant surprise, several tribes had copied our approach.
When something spreads and goes internally wired – that’s the best “proof” that the tool/technique/method is useful and valuable.
.
Possible Variations
If this approach inspires you, but you don’t use OKRs in your team or department, there are many variations to this that still transforms a static forecast into continuous conversation that trigger important dialogs.
.
Forecast Poker Planning
If we assume that we are working on something that we can’t ship or deliver until a specific set of problems have been solved or features completed, then we can ask the members of the team to individually guess “How many more weeks/sprints do we need to achieve X?” by writing their guess on a post-it.
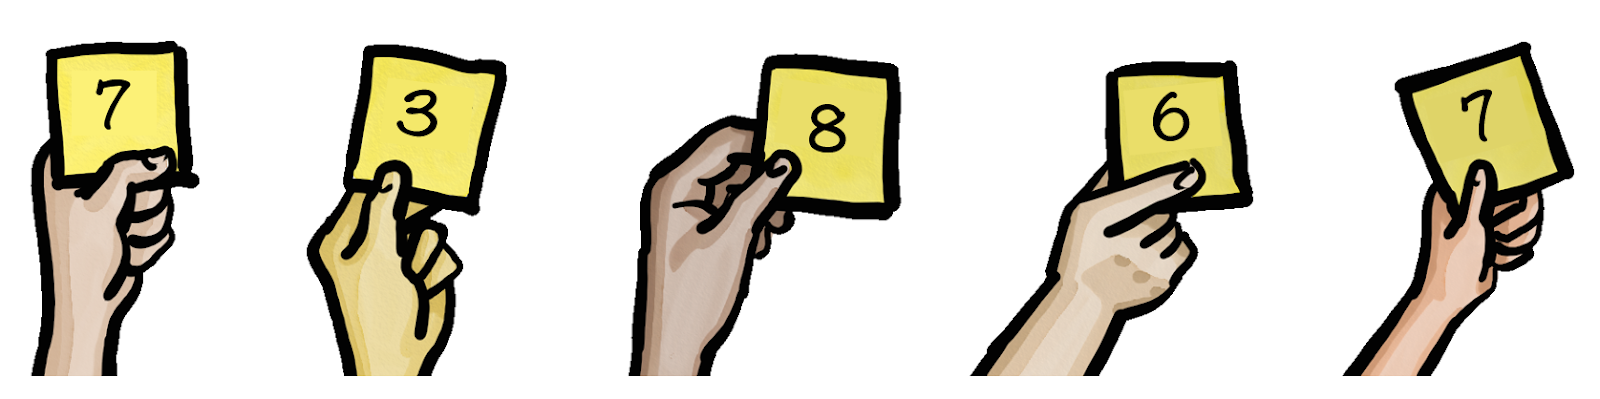
Remove the most pessimistic and most optimistic vote and write down what remains as a range on the whiteboard. If the estimated range doesn’t decrease with one week every week, that’s your opportunity to talk about possible actions or mitigations.
.
Deadline Confidence
Sometimes we need to cope with a fixed deadline. Perhaps we have a limited window of opportunity or perhaps we must fulfil a legal requirement by a specific date (for example GDRP). Then we can ask the team “How confident are we that we will accomplish X before date Z?”
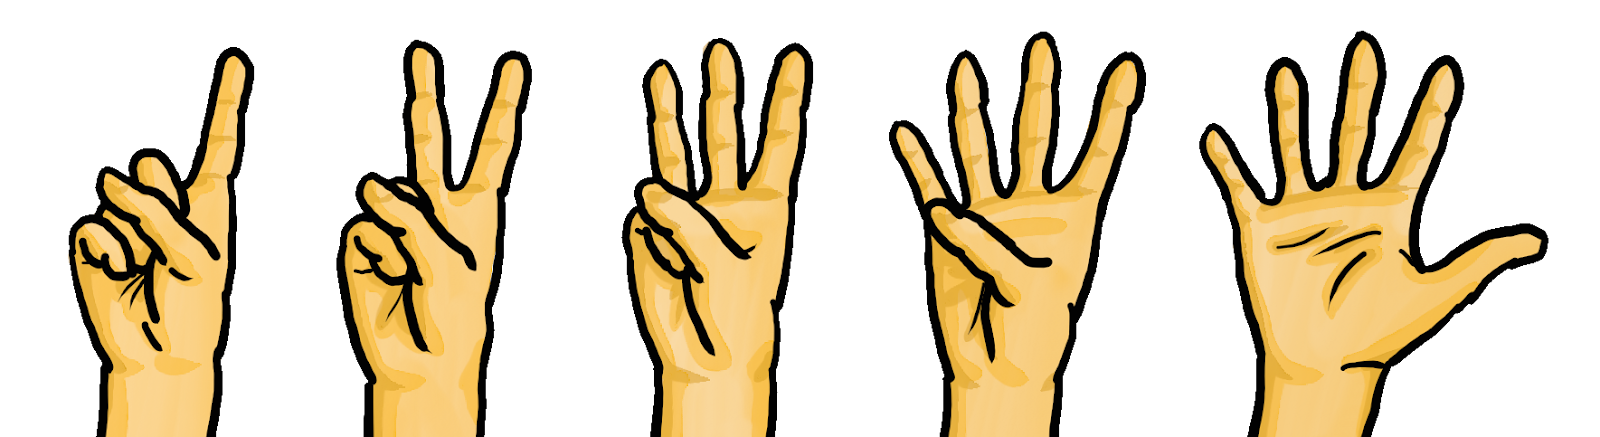
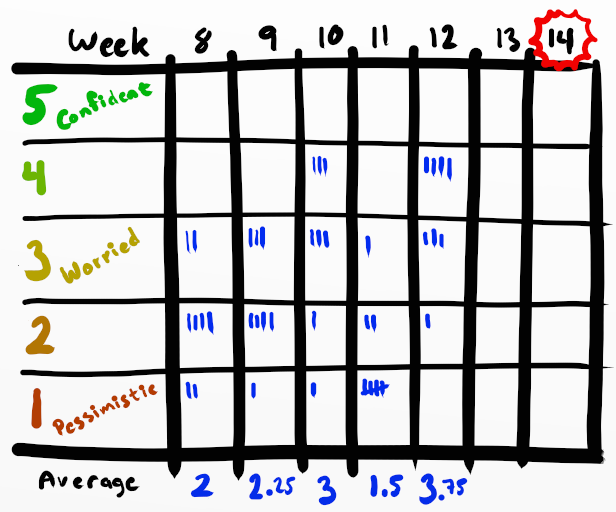
This vote could be done with a fist of five. One finger representing super pessimistic and five fingers super optimistic. Three fingers could mean nervous. If the confidence doesn’t increase week over week, we talk about what needs to be done or which options we see before us.
.
Release Guesstimation
Some teams ship continuously but still have the need to communicate progress and expectations to stakeholders and customers. They have a backlog which they pull from intro their Sprints.

On way to visualize forecasts is to add two lines (for example with adhesive tape) into the Backlog.
Each Sprint Review the members of the team ask themselves two questions:
“How much of the backlog are we super confident to have delivered within the next four sprints?”
“How much more is it possible that we might deliver, within the next four sprints?”
A green line is drawn to visualize how far down the backlog we feel confident we will complete. The red line is drawn to visualize the optimistic scope.
If the team estimates their User Stories with Story Points and keep historic log of ther Velocity, this is of course great input to the team’s guesstimation exercise.
The timeframe “four sprints” can of course be replaced with “next two months” or something else that feels appropriate for the team.
.
To Conclude
Don’t make your estimates, plans and forecasts into a static digital document, residing deep in cloud folder. Visualize it. Make it accessible. Frequently gather in front of the visualization and share progress, update the forecasts and discuss how you can help out to mitigate obstacles and resolve dependencies. Make it into a living dialog.
It’s no rocket science. It’s a simple healthy habit.
Thanks! Great inspiration.
Thanks for sharing!
Great! Thanks for sharing
Great sharing. A good use case combined OKR with Kanban concept
Hi,
We are working with the SAFe framework & use PI objectives (including business value), but we are looking into OKR as our strategic leadership is using them for their strategic themes. But we don’t know how to take the next step, so now we have our features which are rolled up into PI objectives, but how are features then related to OKRs? Objective I understand, but how do features & KRs relate to each other? and how does it then further roll up to the strategic OKRS? Is it our objectives which roll up to their KRs or Objectives? Not sure if my questions are clear 🙂 but this article is very interesting!