Sometimes you need a second opinion on a system. The underlying reasons would easily fill another blog post, so let’s stay on track. This process can be made lengthy, and obviously, the more time spent, the better the assessment. However, if you want to adhere to the Pareto principle (80/20), it can be done in two hours… or so I claim. Here’s what I do: I ask for five things, and I do one exercise.
Thing #1: The System’s Build and Deployment Tooling and Process
Regardless of system platform and environment, how is it built and deployed? What artifacts does the build produce? What does the actual deployment look like, and how often is it performed? On one side of the scale you’d have CI/CD with 100% automation, frequent releases of something that is probably a container of some sort. On the other side you have the trauma-inducing build performed on rare and special occasions (because it’s scary and fragile). Minus points for manual deployment to a snowflake server by a “guru” or “ninja.”
Thing #2: Tests
I ask for test coverage. Mature teams ask back: “By what tests? Unit, integration, or end-to-end?” When doing this quick assessment, the number isn’t important. What is important is that the number is available and that it’s not zero. While in this area, I also browse some unit tests and I look at their names, length and complexity, and assertions/verifications. Guess what the score is if there are no tests.
Thing #3: Linting and Other Support Tooling
All ecosystems have some kind of linter; often several to chose from. I expect the code to be linted, and I also ask for other tools like FindBugs, Code Contracts, or Vulture (these are just examples). It’s often a good sign that a team is using something like SonarQube, especially if they can explain how they use the data. My experience is that use of such tools is kind of binary: either the team is good and does CI/CD, proper testing, and runs these tools. Or, the team has a long journey ahead of it, and failed linting is the least of its problems.
Thing #4: Reference Architecture and Documentation
What kind of system are we looking at? Believe it or not, but there are not that many reference architectures out there, and explaining your system’s reference architecture should be an easy task. I also ask for the architectural documentation. Code should be self-documenting, systems, not so. Code can’t convey the system’s context, its users, common scenarios, physical deployment, and non-functional attributes to mention a few sections I expect to find in the architectural documentation. Systems that are documented along these lines lose: “Users log in to the system using usernames and passwords stored in MySQL. The system is deployed on 10.20.30.1.”
Thing #5: Code Profile
I like to call this “reading code squinting.” I don’t literally squint, but I look at the code from a distance by reading the filenames or class names. Let’s say I’m examining a web shop that sells ecological products. I expect to see files/classes called Cart, Customer, Billing, Fruit, and PaymentGateway; things that let me make an educated guess about the domain without even knowing what system I’m looking at. What I don’t want to see is: JobManager, CustomerJSONAdapter, HomeGrownCache, [by the way, all bad system’s I’ve encountered in my career have implemented their own caches], and DBUtils. I guess I need to be explicit about the irony. All systems will have support code with shady naming. However, such components should be in minority.
If I have access to a person who knows the system who can produce the artifacts and answer questions, I can get a fair feeling for the system in one hour.
The Exercise
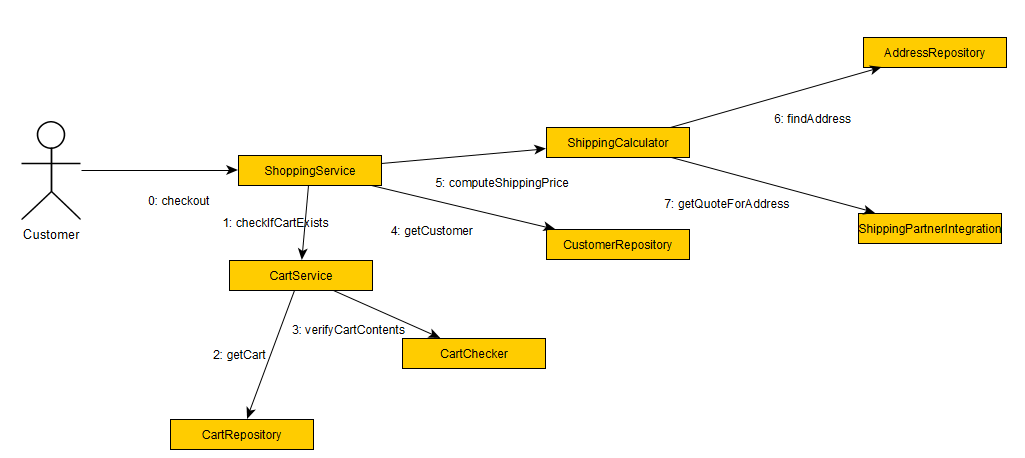
Next, I spend another hour doing a simple drawing exercise using UML collaboration/communication diagrams. These diagrams are my favorites when it comes to capturing both static and dynamic relations between components (most notably classes).
I start the application in debug mode and document a typical use case in the diagram while stepping through the application. The following example is totally made up, but I should be clear enough.

Ok, let’s be honest. I abuse the communication diagram notation quite ruthlessly. BUT, notice how the diagram captures both structural relations and invocation order. The example is artificial and probably bogus, but the point I wanted to make, apart from showing how the diagram works, is that you can use the diagram to detect certain patterns. Good systems will show intuitive call chains and there won’t be that many calls, which means that the design is direct and to the point. Convoluted systems will produce diagrams with arrows back and forth and across the diagram, they will show use of strange components that probably mean accidental complexity, or they will show convergence on Singletons or your home-grown cache. Bad systems also tend to spin around in unobvious support code before getting to the point. I bet you can think of other examples…
Is It That Simple?
So, if the claim is that this workflow produces a good enough preliminary assessment of a software system, what’s the catch? Well… The catch is that this process requires experience from the person doing the assessment. You need to know how systems are built on different platforms (a webpack build is different from creating a pod), what the archetypical architectures are, what good tests look like, and which components are most likely bogus (yes, the home-made cache). You will not learn this in the university, or in an accelerated learning program. You need to put in the hours.
That said, I hope that you’ll find some inspiration in this approach.


Simple and clear. Thanks!
I recognize I’ve used the first three myself, and I combine it with asking tech leads/architect to draw their architecture on a whiteboard. This gives you an idea of the complexity built in and as “if it fits in your head” (ref. Dan North).