If you enter the Crisp office you will see these two A3 papers on the wall (click picture for bigger version)
Here is an english translation of these pictures.
The first picture is titled “What is Crisp?”. It defines our purpose.
The second picture is titled “Crisp strategy”. It defines how the company works and why.
Both papers are hand-drawn using a lead pencil. Why? Well, so we can change it easily! Anybody can change & improve it. Usually we do it at our internal conference (twice per year), and do a consensus vote to ensure that everybody agrees that the change is for the better.
How we discovered our identity
Once upon a time we were more like a normal company. And like most normal companies we didn’t have a very clearly defined vision and strategy. Every conference we would spend lots of effort around a big conference room table attempting to define these things, but the only results would be a bunch of wiki pages (our intranet) with lots of different options and ideas. No clear decisions. And by the time we got to the next conference nobody remembered what we said last time, so we’d have to dig up those old wiki pages. So even if the vision and strategy had been good, it wouldn’t have been useful because it was too wordy and buried in a wiki so nobody remembered it. Ever been there? I bet you have :o)
After a few years of doing this I decided to try something different. An experiment of sorts. Here was the idea:
- We already have a vision and strategy. It just isn’t described in text. So instead of trying to define a perfect vision & strategy, let’s try to discover the one we already have and put words to it.
- Make it physical, draw it on paper rather than on the wiki. That way it really exists. We can look at it, point at it, take it with us, change it. And there is only one master copy, the physical one. Any photos or replications are just that – replications.
- Draw it in pencil, so it is clear that this isn’t perfect or final. It is something that can be improved over time.
- Limit the space. If we can’t fit so much stuff, we have to pick our words and pictures carefully. And as an added bonus it is easier to remember (and therefore easier to relate to).
- Make it highly visible. Put it on the wall in a prominent location in our office, bring it to all conferences. Put photos on the front page of the wiki.
- Get buy-in. Ensure that everyone agrees that this is our vision and strategy.
I decided to limit it to one single A3-sized paper. Eventually it turned into two, but never mind that for now.
The first A3 was supposed to answer the question “What is Crisp”. Our identity and, in a sense, our vision. To answer this question I decided to meet everyone at Crisp individually (about 15-20 people at the time) and ask the simple question “Why are you here? <working at Crisp>”, and wrote down the first words that came out of each person’s mouth. I met just about everyone, and called the people I couldn’t meet.
I figured that it can’t be a coincidence that such a group of inspiring & talented people end up at the same company, there must be some kind of common set of values. And much to my relief, there was. So I simply wrote down the values that everyone seemed to have in common, the values that attracted them to Crisp and kept them there. I also tried to define a scope – as in “what is Crisp, and what is Crisp not?” After all the interviews it was pretty clear – we are IT consultants. We do all kinds of stuff within IT, we work within lots of different businesses (banking, gaming, media, etc), and in lots of different roles (developer, coach, manager, trainer). But it is all IT related, and it is all somehow related to consulting.
So I wrote this down, drew a cute and simple visual representation of these words, and voila – the first A3 was done. I’d say the whole process took less than a couple of days of actual work (but several weeks of elapsed time).
Next step was to seek buy-in from the whole group. Without that, the whole exercise would be useless.
I found a very useful trick for this. Instead of asking “what do you think of this, is it OK?”, I said “Here is our identity. Can you think of a better description?” That way there is no way we could end up with nothing. Either my version is OK, or someone will propose a better one and I could ask the whole group to vote which one is best. After a couple of iterations of meetings and minor modifications we had a version that the whole group accepted and liked. We had an identity!
How we discovered our strategy
I realized that something was still missing though. The “what is Crisp” A3 was a very important statement, but it wasn’t very concrete. It didn’t say anything about how the company actually worked, how we succeed, how we differentiate from other companies, etc. So I decided to create another A3 for that. It felt important to separate them though – the first A3 is about Why, the second A3 is about How. I realized that we had been pretty successful as a company so far, and that it wasn’t really clear to most of us HOW we had succeeded. I was convinced that this knowledge would help us continue to succeed (or succeed even better) in the future.
So I pulled out another blank A3 sheet and wrote “Crisp Strategy” at the top. This one turned out to be easier than the first. I started thinking about what had made us succeed so far, and talked to some colleagues. The list became quite long, so I turned it into an FAQ and prioritized the list. I then started pasting items (physically!) on to the A3 paper, in priority order, until it was full.
As a side note, I had recently read two very inspiring books:
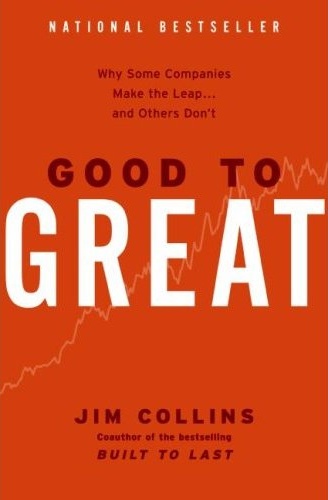
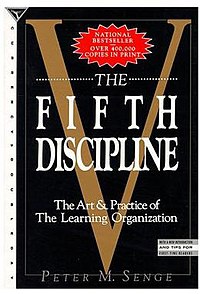
With these books in mind, I drew a Cause-Effect diagram in the bottom right corner of the A3, illustrating two positive reinforcing loops that I believe have had a strong impact on our success as a company so far. In fact, I wasn’t really aware of the loops until I actually drew the picture!
Loop 1 (left side):
- Competent & motivated consultants do a better job, which leads to happy customers
- Happy customers give us a good reputation
- Good reputation increases our motivation further & attracts new competent people to our company.
- GOTO 1
Loop 2 (right side):
- Competent & motivated consultants do a better job, which leads to happy customer
- More and happier customers leads to higher profit
- Higher profit means people can afford to spend time learning new things (instead of trying to make every hour customer-debitable), and feel more safe doing so.
- Taking time to explore and learn new things together makes us more motivated and more competent!
- GOTO 1
(hey, when was the last time you got to write a GOTO statement :o)
Consequently, we should focus on keeping ourselves and our customers happy, not focus on making money. Good reputation and profit is simply a side effect of keeping ourselves and our customers happy. This was an eye opener!
By the way, I’ve found cause-effect diagrams to be useful in all kinds of situations, so I wrote an article called Cause-effect diagrams: a pragmatic way of doing root-cause analysis.
What was the impact of making our identity and strategy explicit?
The two A3s came up on the wall in spring 2009 and have been part of our culture ever since. When visitors come to our offices I see colleagues point to the A3s and describe them. We do training courses in our office fairly regularly, and every time at least a couple students start asking about the A3s and get very inspired. I’ve been invited several times to help other companies do the same.
When we have important decisions to make in the company, or problems or conflicts, I often hear people refer to our core values and use those as a guide to resolve the decision/issue/conflict.
We bring both A3s to our internal conferences and put them up on the wall there. People gather around it, talk about it, sometimes propose improvements or discuss our current strategy. The papers become a focal point.
Now a days one our primary metric is “Nöjd Crispare Index” (in english: “Happy Crisper Index” or “Crisp happiness index”). Scale is 1-5. We measure this continuously through a live Google Spreadsheet. People update it approximately once per month.
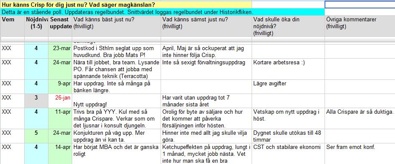
Here are the columns:
- Name
- How happy are you with Crisp? (scale 1-5)
- Last update of this row (timestamp)
- What feels best right now?
- What feels worst right now?
- What would increase your happiness index?
- Other comments
We chart the history and how it correlates to specific events and bring this data to our conference.
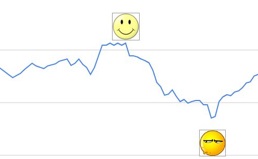
Whenever the average changes significantly we talk about why, and what we can do to make everybody happier. If we see a 1 or 2 on any row, that acts as an effective call for help. People go out of their way to find out how they can help that person, which often results in some kind of process improvement in the company. This happened last week, one person dropped to a 1 due to confusion and frustration with our internal invoicing routines. Within a week we did a workshop and figured out a better process. The company improved and the Crisp Happiness Index increased.
Crisp Happiness Index is more important than any financial metric, not only because it visualizes the aspect that matters most to us, but also because it is a leading indicator, which makes us agile. Most financial metrics are trailing indicators, making it hard to react to change in time.
As a result of understanding our own values better, we’ve dramatically changed our partnership contract between Crisp stock owners. We’ve literally made our own stock worthless (at least from a pure monetary perspective) – it is now pretty much impossible to get rich by buying or selling Crisp stock. This is by design, because we realized that the purpose of Crisp is not to enrich it’s owners – in fact a model that enriches the owners would conflict with our real goal – to be a home for IT consultants. So there is nothing stopping Crisp consultants from earning money (and some earn quite a lot). But Crisp itself is essentially a non-profit organization, and there is no monetary benefit to being an owner/partner.
We also learned about our growth plans and recruitment approach. The question “how big should we get” (as in how many people should work at Crisp) had come up several times in the past. Now we realized that this is not a parameter we should be controlling. We noticed that, with our model, we don’t have to actively recruit. People come to us instead.The size of our company is a consequence of two balancing forces: how many good people come knocking on our door, and how much growth pain we are experiencing. The “Crispare Happiness Index” helps us see growth pain.
When we interview new potential recruits we bring the A3s (or photo printouts in case we aren’t near the office) and talk through it. The response is usually very positive, they love it!
I’ve also noticed that many of us have internalized (memorized) the words on the first A3 and use them when describing Crisp to other people. We don’t all describe it the same way, but that’s OK. Different people emphasize different parts depending on their own priorities and who they are talking to. But nobody disputes the core values, they are the glue that keeps us together.
Why tell the world about this?
Why am I writing about this? Isn’t strategy something that a company should keep secret? What if our competitors find out? What if they copy us?
If these questions are in your mind then re-read the A3s and think again :o)
It’s the same reason I give away almost everything else that I do – music, books, articles, code, etc.
Conclusion
We do a lot of experimentation at Crisp, but all in all I’d say this particular experiment was the most successful one – i.e. highest benefit with least effort! Like most startup companies (Crisp was started around year 2000) we’ve had our share of internal conflicts. But having a clearly stated set of values and a matching strategy has certainly helped us avoid new conflicts. Or, more like, helped us identify and solve potential conflicts early while they are still small and simple.
Oh, and we learned a lot too. Which, of course, was one of the core values :o)
The important thing is not really the content of the A3 sheets. The important thing is how they were created, how they are used, and the fact that we now have an explicitly defined identity & strategy, which makes it easier to criticize and iteratively improve over time.


Hi Henrik,
I personally love this model and hope to one day soon work with other like-minded people under a similar style of organization. There’s a good chance I’ll be instigating the creation of such an organization here in my area.
You actually work and live under the values and principles that are important to you – as do your fellow Crispers. It’s not often you hear about companies that truly do. It is inspiring to read and learn about the success of an organization that operates in this manner. Thank you for sharing this with the world!
– Selena
Selena, before you instigate your own, talk to me as there are a few coaches who have been working on a Crisp-style model already. We’re getting closer to formalizing it.
Henrik, curious to know if any of the Crisp consultants also market themselves under their own brand and work to maintain that brand.
Hi Henrik,
Great post! I admire your approach. I have translated your two A3 in french C’est quoi Crisp ?
Regards,
Fabrice
Cool :o)
Hi Henrik,
I really like to see the approach used by others.
We also use one-pager strategy for our clients and it also somehow takes one A3 page (both sides of it). So we can probably call it standard by now 🙂
My experience is that the probability of the strategy document actually being used is inverse proportional to the size of the document itself.
So one pager is 10 times more likely to be used than a 10 page strategy :).
“the probability of the strategy document actually being used is inverse proportional to the size of the document itself” Brilliantly put! Thanks Sergey :o)
Thanks for sharing! I find this very inspiring.
Read this after you spoke at the South Africa Scrum Gathering. Fascinating – great – thank you!
Is the plotting a manual process or have you found a way to automate it?
It is a graph object in the google spreadsheet, automatically updated. The wonders of modern technology…
Excellent post and i really like the idea of continuous happiness measurement. Have you applied this on a project level as well (a kind of continuous input to retrospectives)?
Yes, and it worked really well. A serious problem with motivation was highlighed and solved within 3 months. The average motivation went from around 2 to 4, and it was directly noticable in the culture and atmosphere of the project. Highly recommended.
The Happiness Meter seems like a great tool. I did notice that you have name as the first column. This means it is a very open and collaborative environment as people are willing to express opinions without fear of repercusions. I wonder how would you use that in a corporate environment where people are less certain of the consequences of being open.
Please, fix a link for ENG
https://www.crisp.se/file-uploads/what-is-crisp.pdf
Taken care of now. Thanks!
I always like to say, “Vision is something you can see.”
It looks like Crisp is doing that. You can literally see the vision.